Back to Tools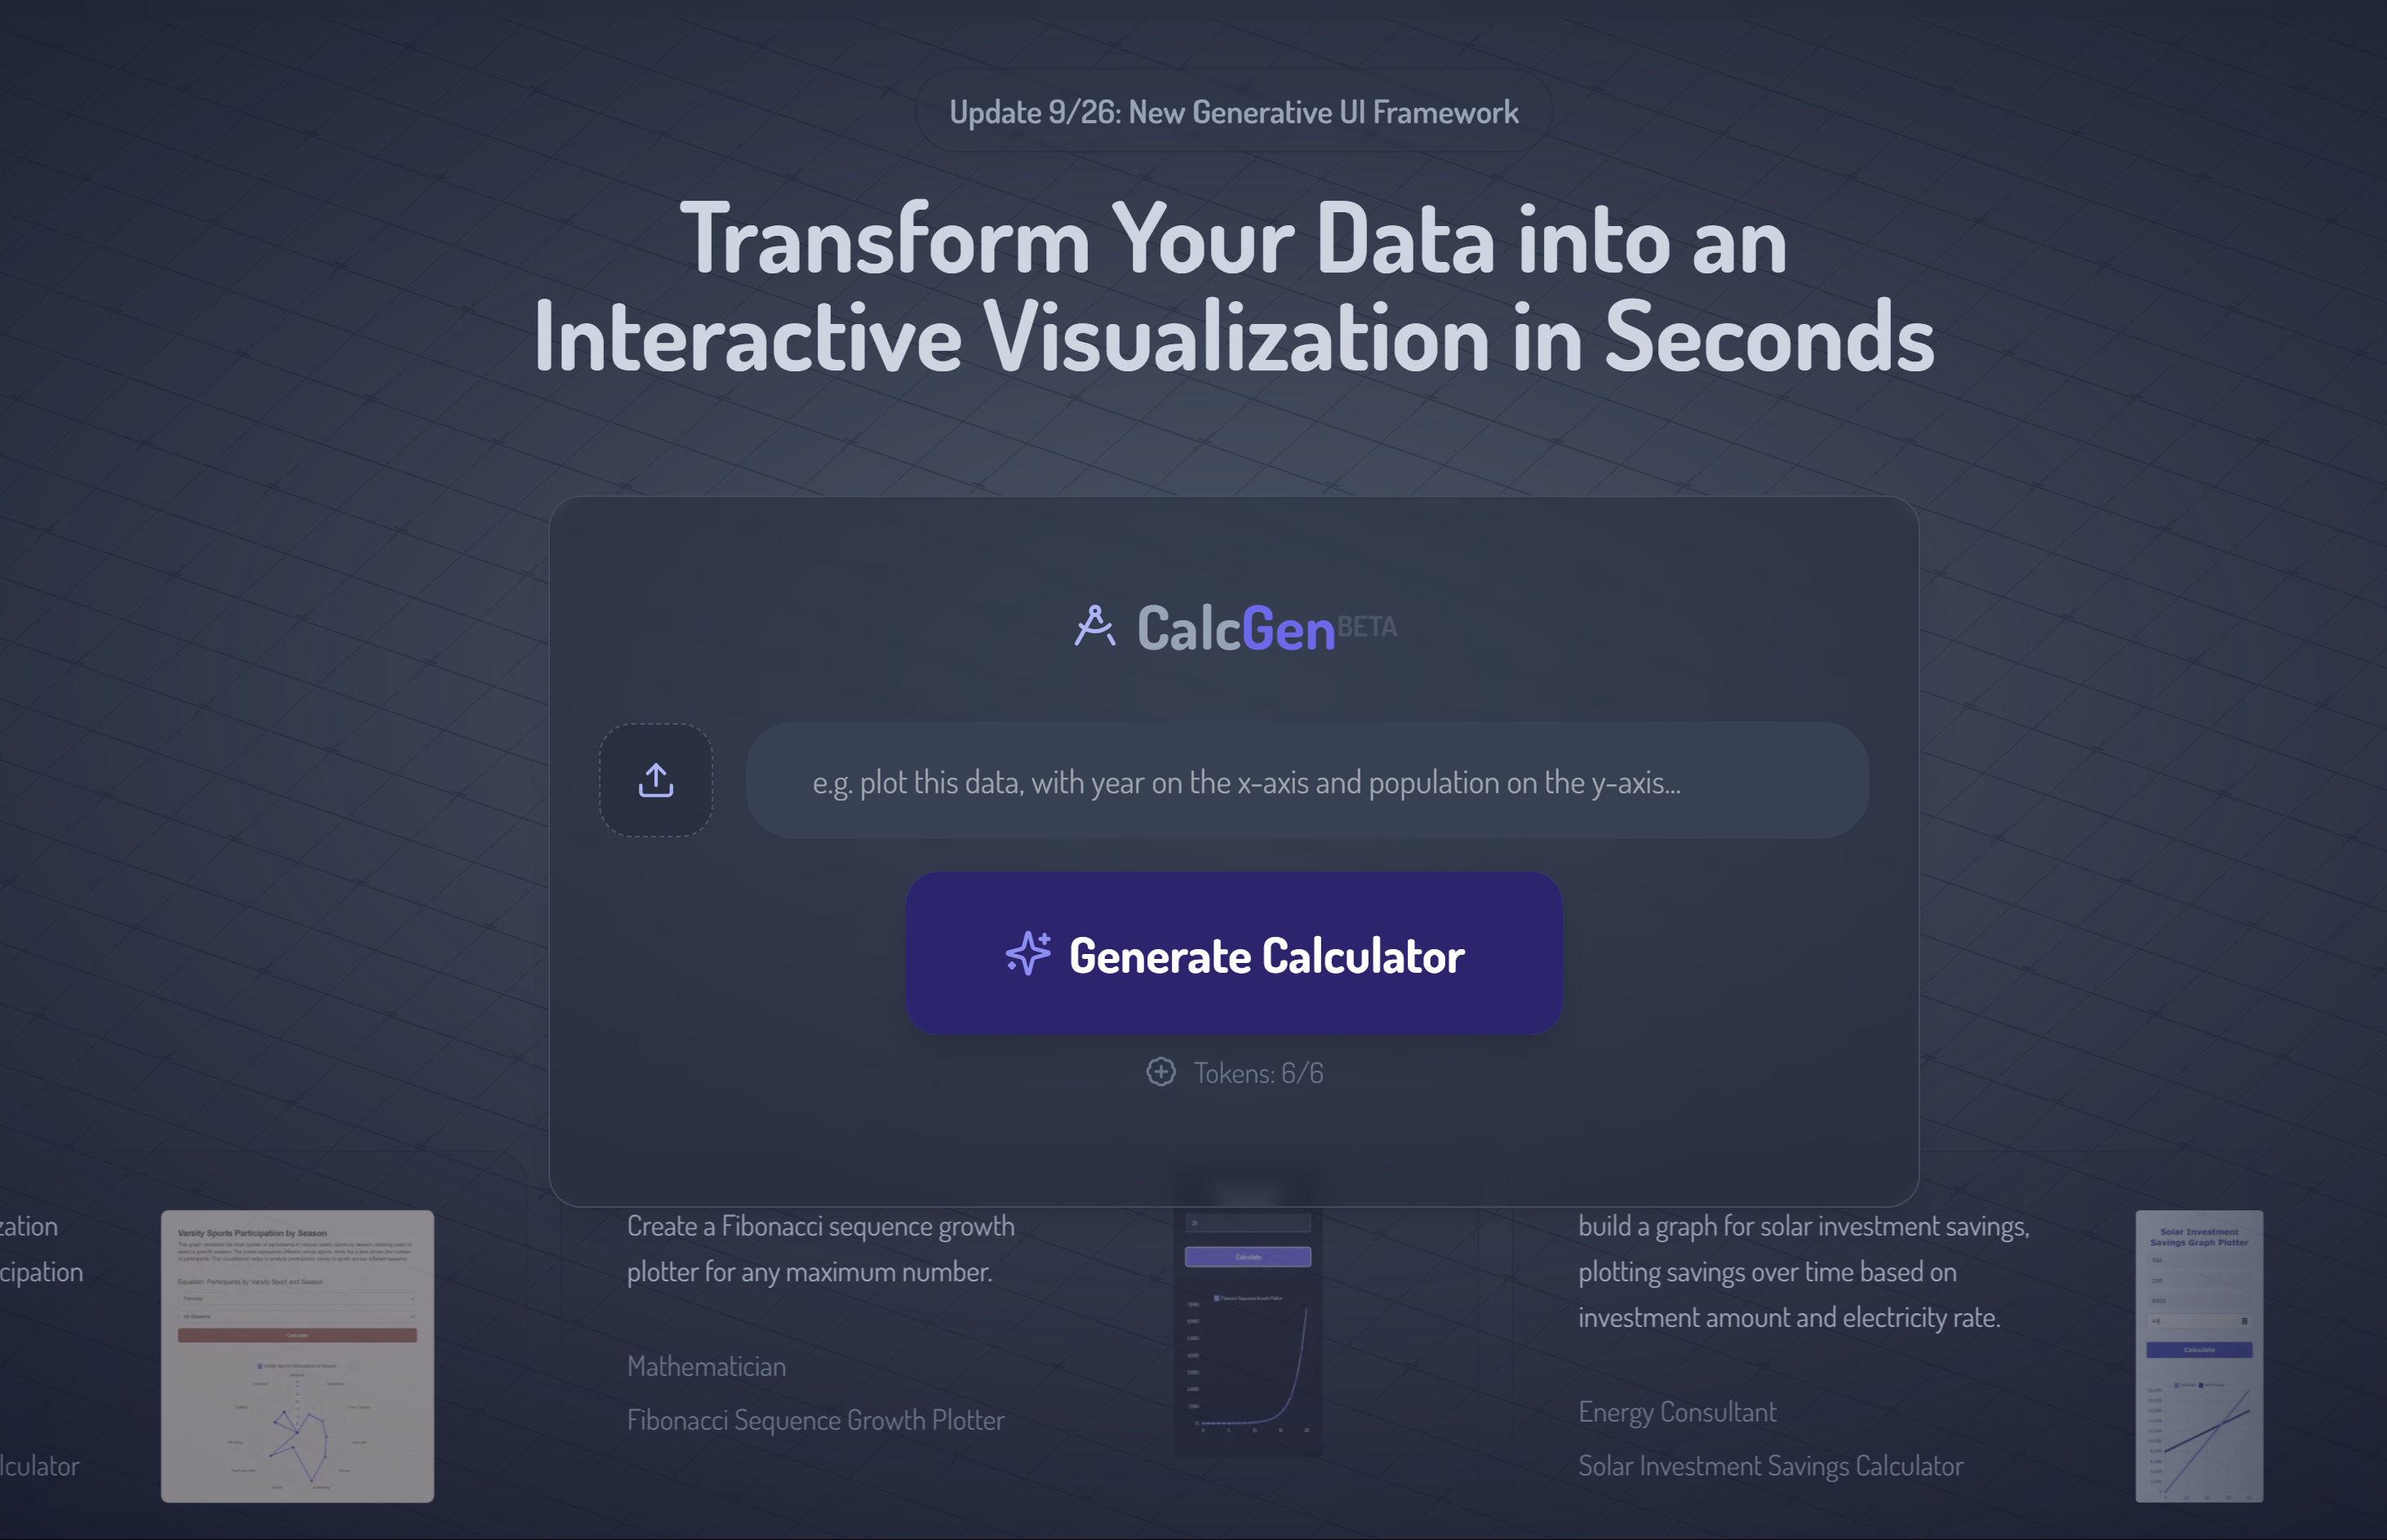
CalcGen AI: Create Interactive Charts, Graphs, Calculators, and Data Visualizations Effortlessly With AI
Category: Productivity
Field: Data Visualization
Type: SaaS
Use Cases:
- Business analytics
- Educational presentations
- Market research visualization
Summary: CalcGen AI provides a cutting-edge solution for generating stunning and interactive visual data representations using a user-friendly interface. Designed for both professionals and casual users, this platform simplifies the process of creating charts, graphs, and calculators, making data visualization accessible to everyone. Whether users need to plot trends, compare datasets, or represent complex functions, CalcGen AI allows them to do so effortlessly with just a few prompts, streamlining the decision-making and reporting processes in business and education.
Learn more